Graphs
.
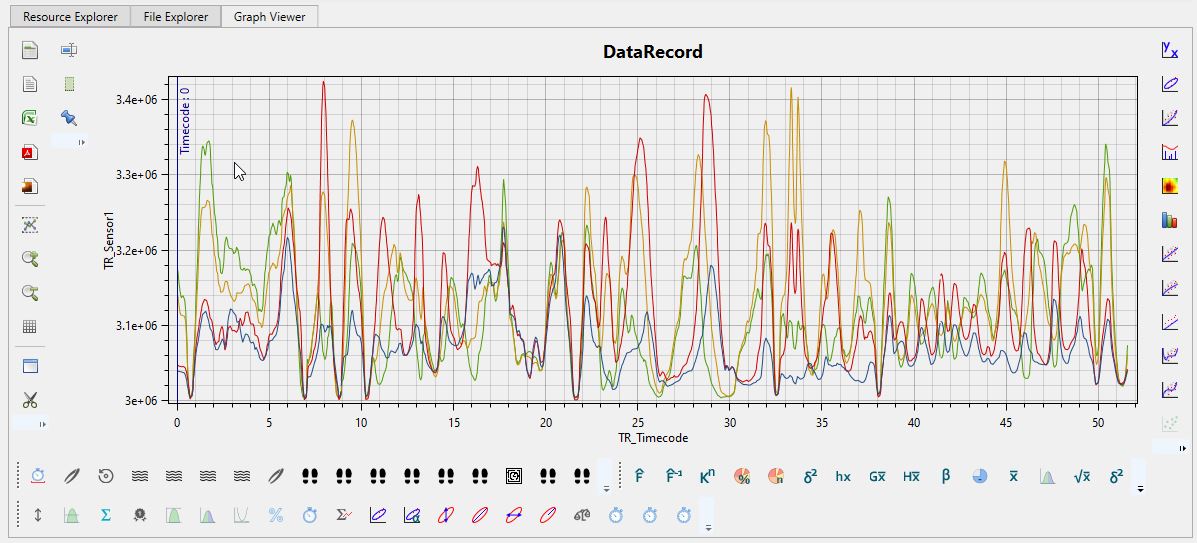
VRmaze provides a graphing system to format various sets of digital data. This numerical data can come from various sources such as DataRecords, mathematical functions or even audio curves.
Interest of the graph system
The interest of the graph system is to offer a visualization of a dataset that would be complex to visualize in another form.
Interface
The graphical viewer allows an interaction with the mouse:
| Interaction | Consequence |
|---|---|
| Drag and drop + right mouse button | Lateral move |
| Key A on keyboard | Frame |
| Mouse wheel | Zoom +/- |
| Drag and drop + mouse wheel button | Interactive Zoom |
| Drag and drop + left mouse button on a curve | Curve information under the mouse |
The toolbar
The graphical viewer provides access to a productivity toolbar.
- Display the table of values
- Export values in .csv format
- Export to pdf format
- Export to png
- Zoom in / out
- Show / hide the grid
- Create a new independent viewing window
- Extract a new dataset by interactive selection
Tool Accessibility
Some tools in the toolbar are only accessible depending on the type of graph displayed or the entity selected in the protocol tree.
Advanced functions of the graphic viewer
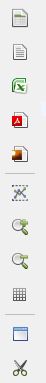
Animation curves
The graphic viewer offers some interaction functions within the graphic itself, for example it is possible to change the appearance of an animation curve by changing the values of the animation keys directly in the window.
Animation of properties
Property animation is an advanced VRmaze concept described [here] (../animation/animatedProperty.md).
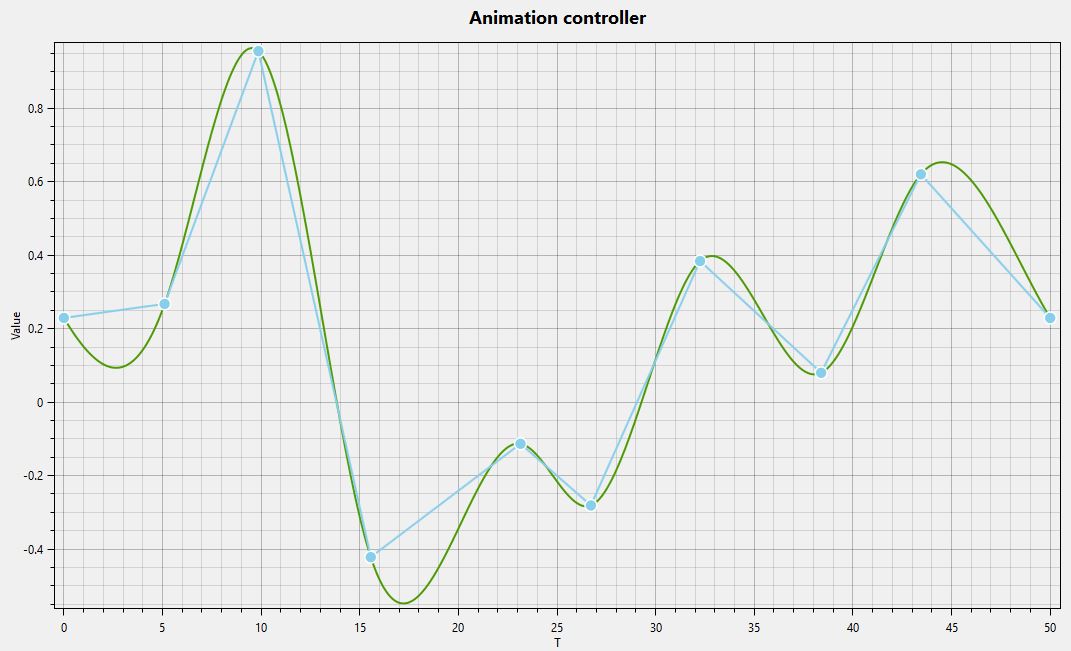
Annotations
.
Annotations are a system for adding information to graphics from DataRecords data sets. These annotations can be created and modified dynamically in the graph viewer.
Saving annotations
Annotations are saved in the protocol file.
Delete annotations
Annotations cannot be deleted from the viewer, but can be deleted from the protocol tree.
Dataset Formatting
The formatting of a dataset of type DataRecord provided by default may not be ideal. VRmaze provides a graphical extension system that allows the data to be viewed in another graphical form.
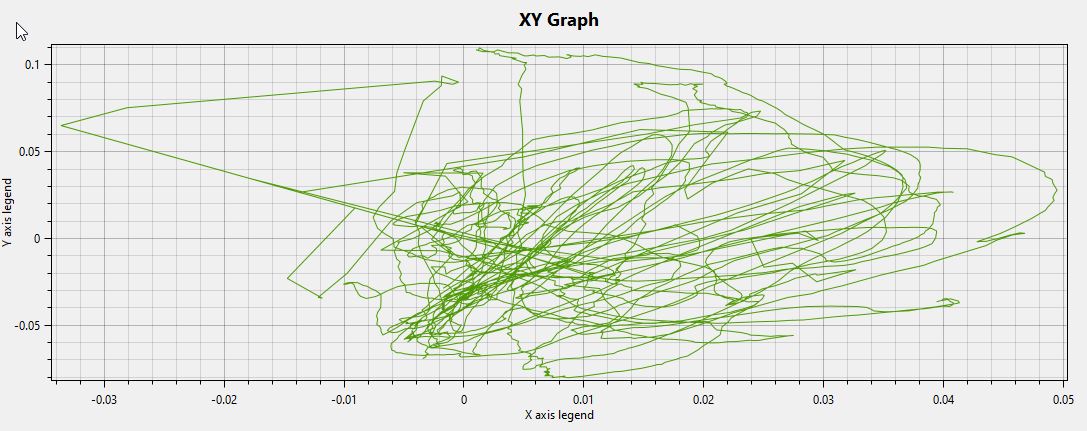
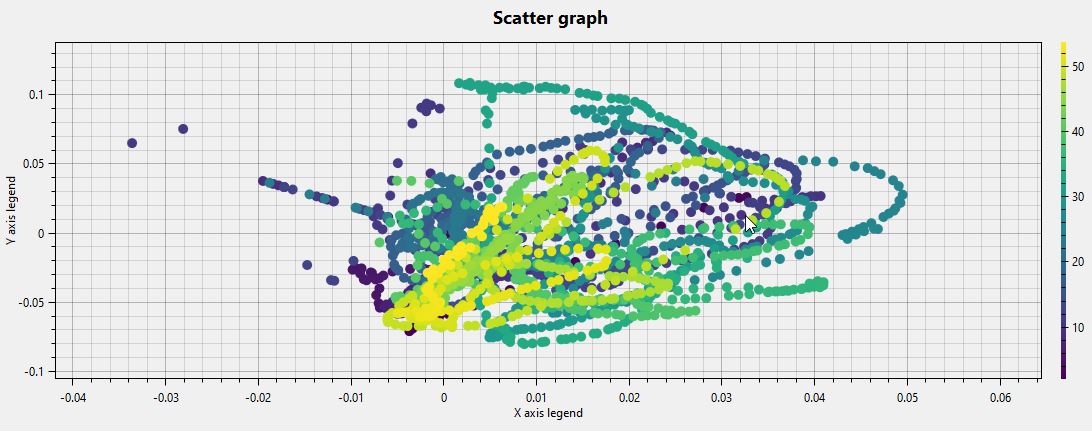
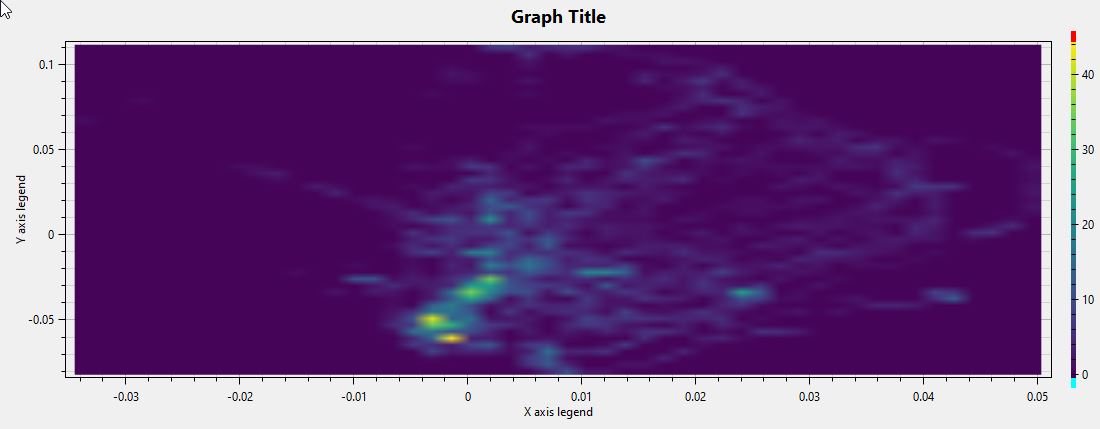
Some examples of graphics that can be made in VRmaze:
Saving Graphs
The graphs are saved in the protocol file.