"Results" dashboard
The "Results" dashboard is used to manage the results database.
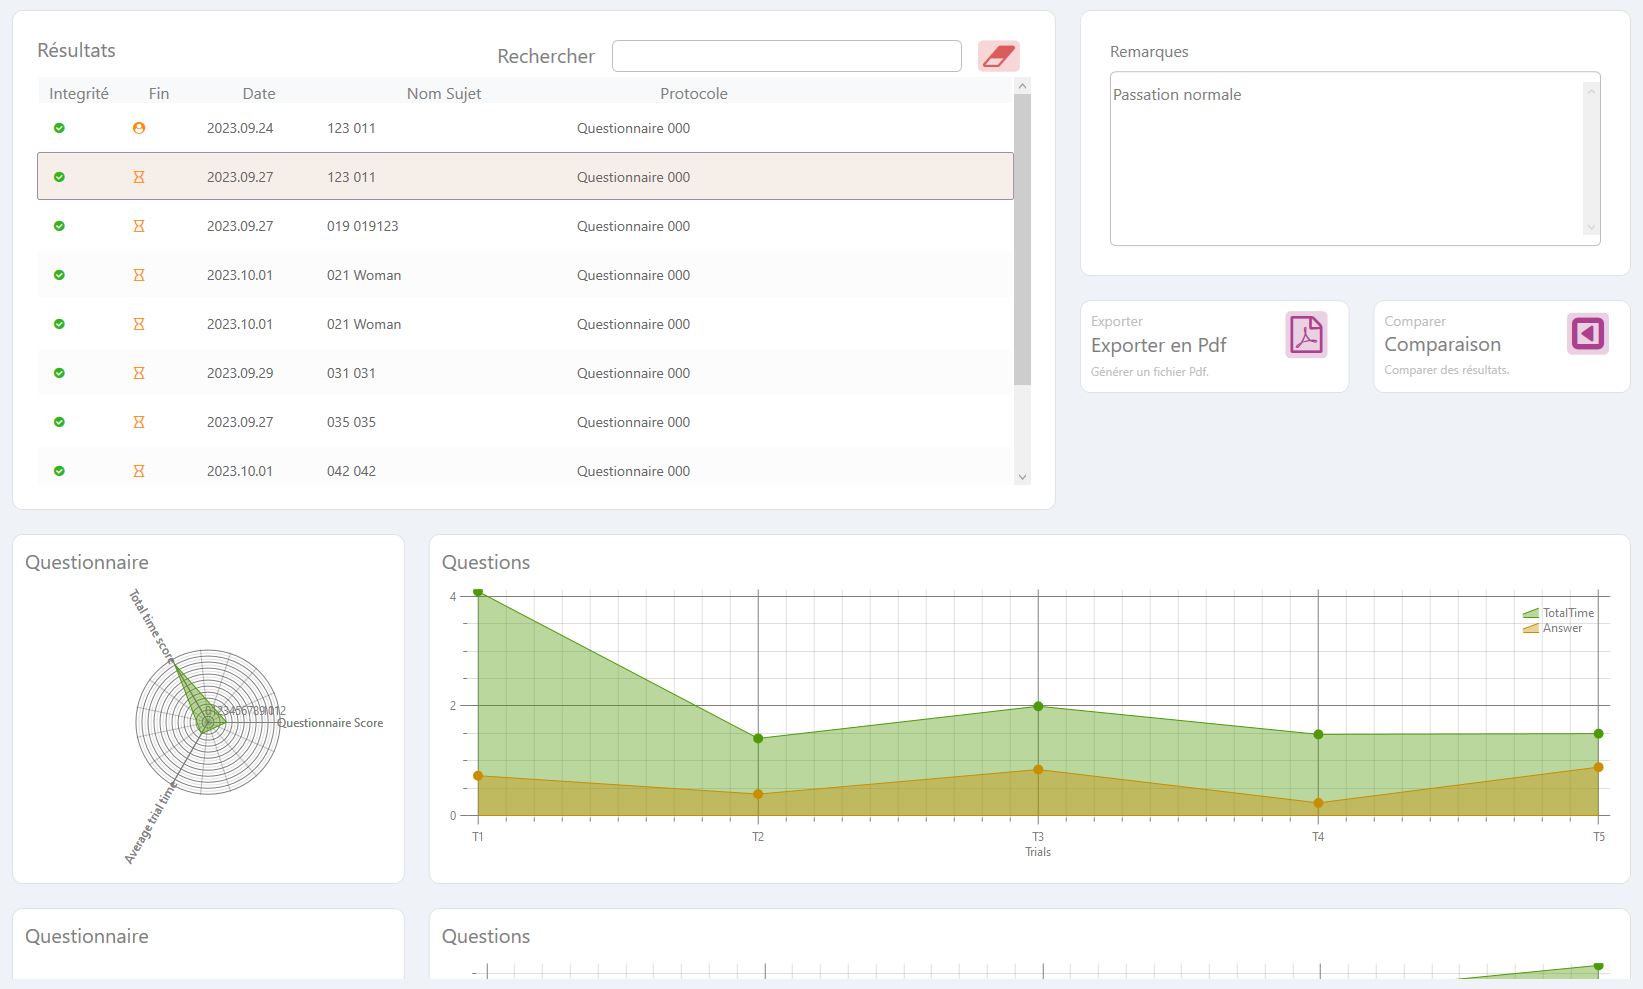
The dashboard offers a list of all available results and simple pass information:
- Integrity (informing on the presence of all pass files)
- End of run type (Normal, Stopped by user, Stopped when max. time exceeded)
- Date of run
- Subject first and last names
- Protocol name
Selecting a result opens the entire run content for graphical display. It is also possible to add a descriptive text of the run to note important remarks.
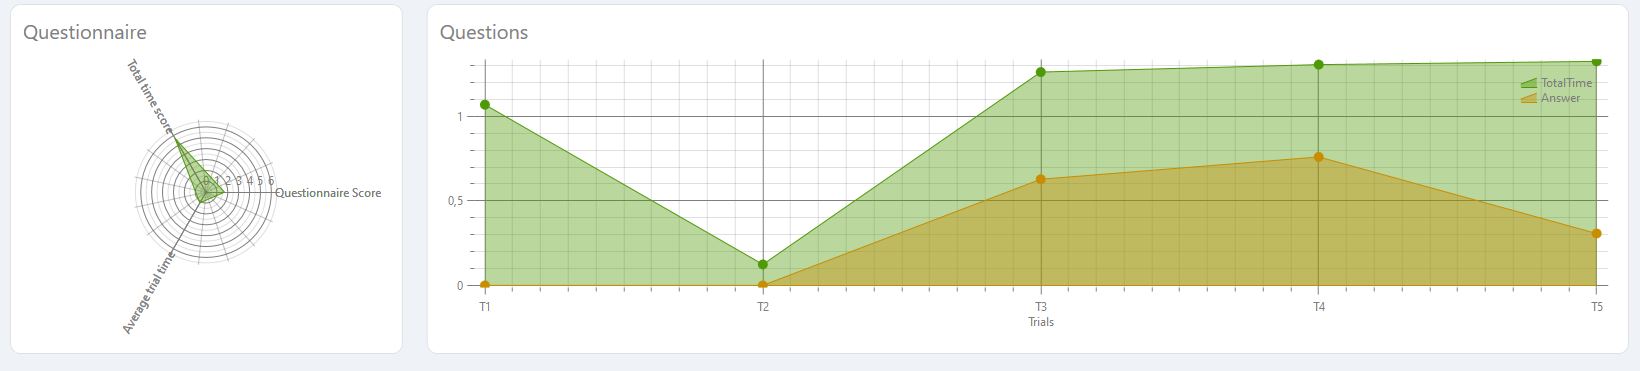
Selecting a result gives access to a number of run charts. For each sub-experiment of a protocol, two graphs are proposed:
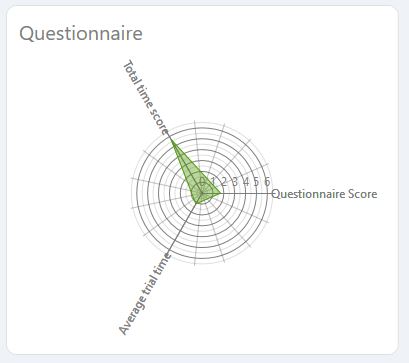
- A score graph
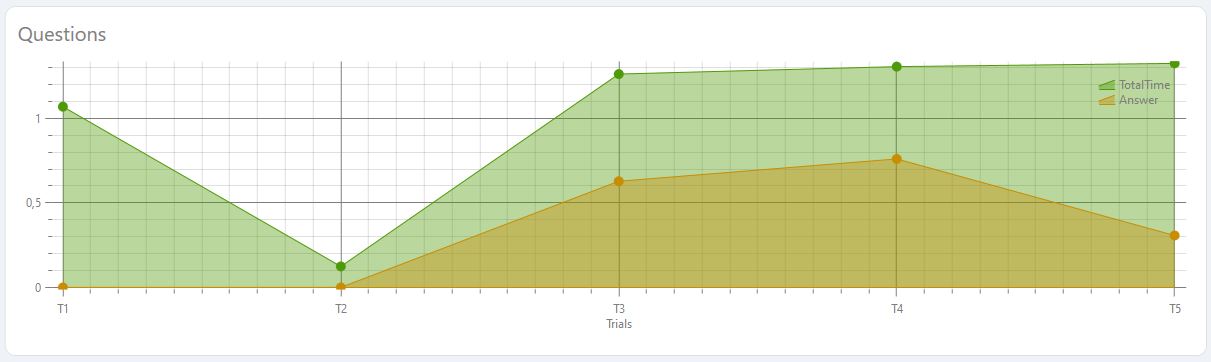
- A graph of trials
The score graph summarizes the experimentation in a few values.
The trial graph lets you find out more about intra-experimental results by analyzing data trial by trial.
In addition to these graphs, a number of actions are available for the selected result:
- Export data in various formats
- Switch to comparison mode (under development).