"Monitoring" dashboard
The "Monitoring" dashboard allows you to view and export results by pass session.
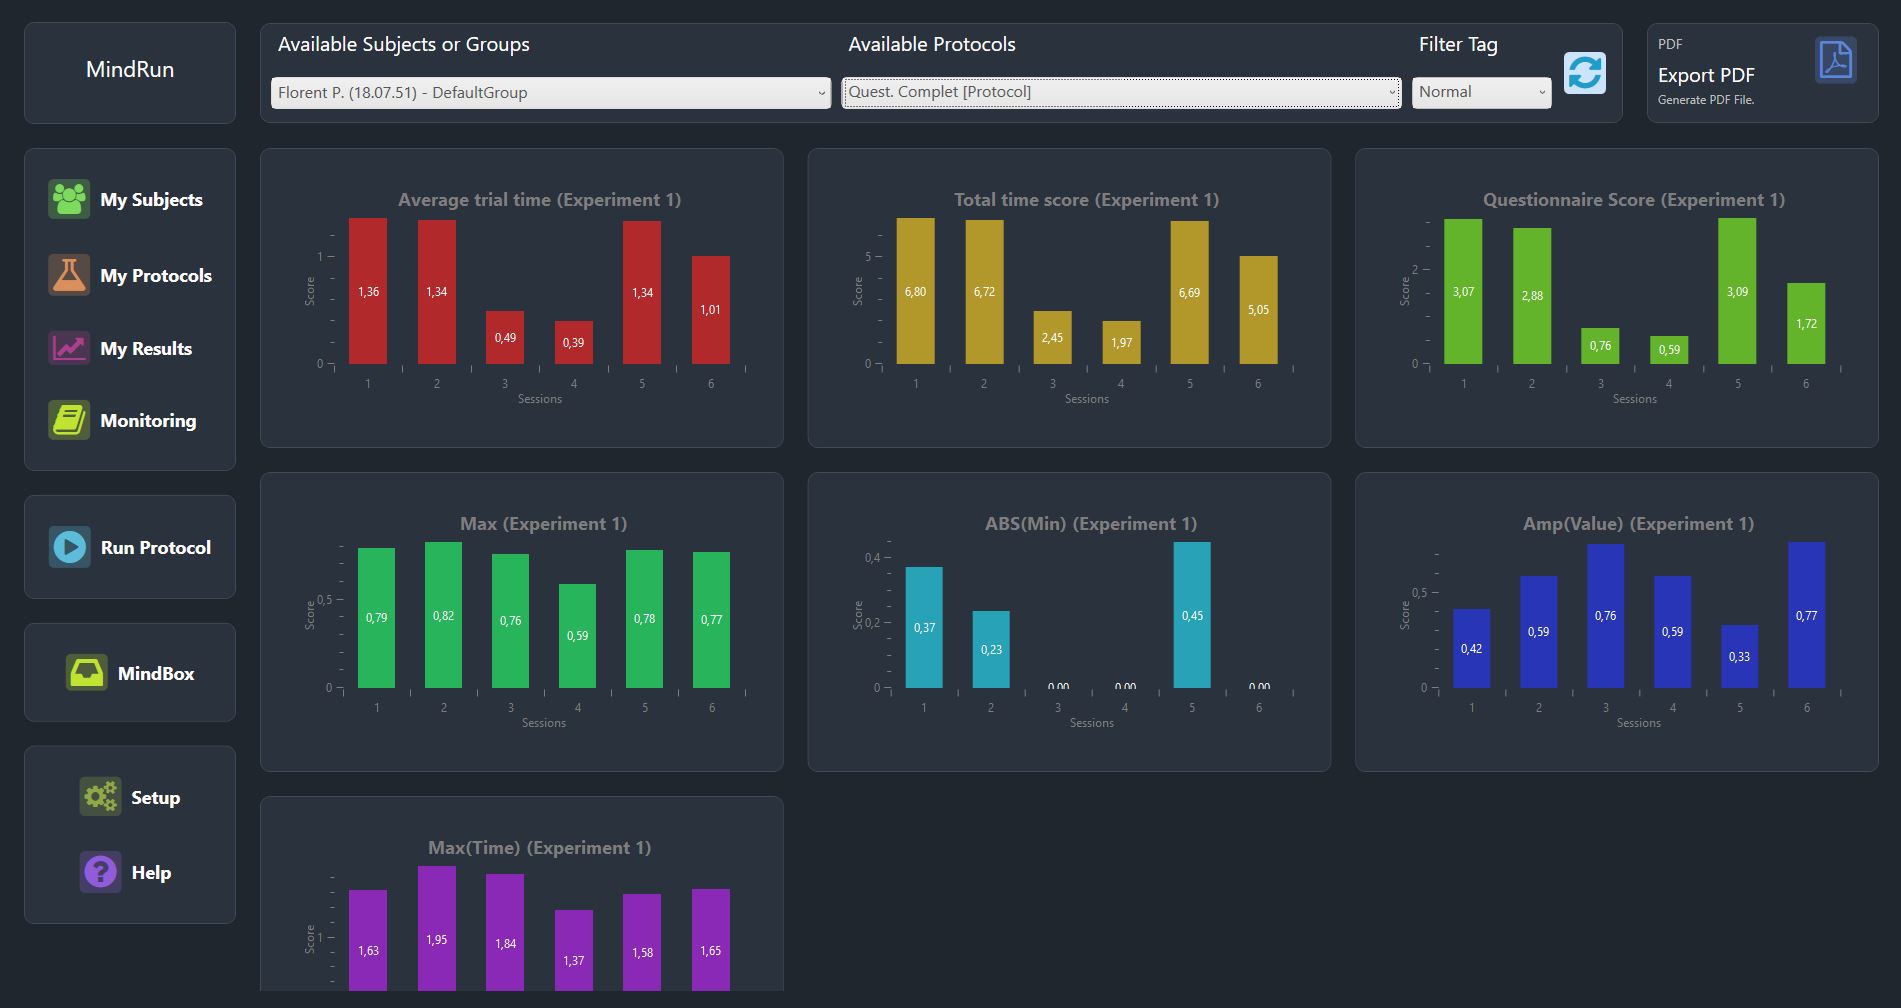
The dashboard provides a list of all subjects who have completed at least one run and a list of all protocols that have been run at least once.
Data can only be displayed by selecting a subject (or group of subjects) and a protocol.
The data can be exported in PDF format. The pdf file contains :
- Information on the subject (or all subjects if groups are used)
- A score graph for each session (averaged across groups)
- A score table for each session (averaged across groups)
Data filter
In version 2025 of MindDev, in addition to the groups and protocol selected, it is possible to filter the results by tags. Tags are available for all results (by default, the tag used is "Normal"). It is thus possible to include or exclude certain runs from the monitoring by modifying the tag of the corresponding result file.